Snippets, Tools and Workflows
1. About
|
Most information is targeted at these topics/environments:
|
Gathering information is one thing - the other is the interpretation and building hypothesis and falsifying them avoiding the common cognitive bias.[2].
A Fool with a Tool is Still a Fool
If you, the humble reader may want to share additional information like snipppets, tools or workflows, please feel free to use the contact form on my blog here: www.hascode.com.

I am a software engineer highly interested in agile software development, lean development, software architecture and continuous learning and curiosity :)
Please feel free to visit my blog or my website for other articles, publications, projects or references of mine.
For legal information please skip to the imprint section.
2. Navigation
This document is structured in the following chapters, please feel free to skip to the chapter of choice.
- Java Analysis
-
This chapter explains how to create thread and heap dumps, how to collect and analyze garbage-collection logs, how to use the Java ™ Mission Control and Flight Recorder, inspecting the HotSpot compiler and debugging native memory leaks.
- Linux System Analysis
-
This chapter gives some examples how to gather system information like RAM, CPU, disk usage, disk speed, cronjobs, network usage and open file handles.
- Rescue Application Logs
-
A short documentation where to find log files for typical software like nginx, apache webserver, MySQL, Postgres, OpenLDAP and Postfix.
- Database Analysis
-
Some examples for analyzing slow queries, table and user locks in Postgres and MySQL databases.
- Log Analysis
-
Snippets and tools for analyzing webserver and access logs.
- Firewall
-
Snippets for logging dropped packets.
- Miscellaneous Tools
-
Miscellaneous tools and resources.
3. Java Analysis
3.1. Thread Dumps / Analysis
A thread dump is a snapshot of the state of all threads of a process where each thread is presented with his complete stacktrace showing its content.
Thread dumps may help in the diagnosis of our application’s threads and for detecting possible deadlocks.
3.1.1. Create Thread Dumps (jstack, jcmd)
jstack PID > thread.dumpjcmd PID Thread.print > thread.dump3.1.2. Create Thread Dump by Killing the Application
Another way to obtain heap dumps is to kill the Java ™ process with a SIGQUIT signal (3):
kill -3 PIDWe may also use Ctrl+Backslash (\) or Ctrl+Break depending on our operating system.
3.1.3. Analyze Thread Dumps with TDA
Thread Dump Analyzer is a GUI tool (swing) to analyze thread dumps.
May be obtained from GitHub.
java -jar tda.jar3.1.4. Analyze Running Threads with Alibaba Arthas
Tool may be downloaded from https://alibaba.github.io/arthas/en/
./as.sh
$ thread
Threads Total: 32, NEW: 0, RUNNABLE: 14, BLOCKED: 0, WAITING: 14, TIMED_WAITING: 4, TERMINATED: 0
ID         NAME                              GROUP                 PRIORITY   STATE      %CPU        TIME       INTERRUPTE DAEMON
58         as-command-execute-daemon         system                10         RUNNABLE   90          0:0        false      true
30         nioEventLoopGroup-2-2             system                10         RUNNABLE   9           0:0        false      false
23         AsyncAppender-Worker-arthas-cache system                9          WAITING    0           0:0        false      true
21         Attach Listener                   system                9          RUNNABLE   0           0:0        false      true
14         ContainerBackgroundProcessor[Stan main                  5          TIMED_WAIT 0           0:0        false      true
20         DestroyJavaVM                     main                  5          RUNNABLE   0           0:2        false      false
3          Finalizer                         system                8          WAITING    0           0:0        false      true
16         NioBlockingSelector.BlockPoller-1 main                  5          RUNNABLE   0           0:0        false      true
2          Reference Handler                 system                10         WAITING    0           0:0        false      true
4          Signal Dispatcher                 system                9          RUNNABLE   0           0:0        false      true
15         container-0                       main                  5          TIMED_WAIT 0           0:0        false      false
19         http-nio-8080-Acceptor-0          main                  5          RUNNABLE   0           0:0        false      true
17         http-nio-8080-ClientPoller-0      main                  5          RUNNABLE   0           0:0        false      true
18         http-nio-8080-ClientPoller-1      main                  5          RUNNABLE   0           0:0        false      true
36         http-nio-8080-exec-1              main                  5          WAITING    0           0:0        false      true
46         http-nio-8080-exec-10             main                  5          WAITING    0           0:0        false      true
37         http-nio-8080-exec-2              main                  5          WAITING    0           0:0        false      true
38         http-nio-8080-exec-3              main                  5          WAITING    0           0:0        false      true
39         http-nio-8080-exec-4              main                  5          WAITING    0           0:0        false      true
40         http-nio-8080-exec-5              main                  5          WAITING    0           0:0        false      true
41         http-nio-8080-exec-6              main                  5          WAITING    0           0:0        false      true
42         http-nio-8080-exec-7              main                  5          WAITING    0           0:0        false      true
43         http-nio-8080-exec-8              main                  5          WAITING    0           0:0        false      true
45         http-nio-8080-exec-9              main                  5          WAITING    0           0:0        false      true
25         job-timeout                       system                9          TIMED_WAIT 0           0:0        false      true
26         nioEventLoopGroup-2-1             system                10         RUNNABLE   0           0:0        false      false
33         nioEventLoopGroup-2-3             system                10         RUNNABLE   0           0:0        false      false
48         nioEventLoopGroup-2-4             system                10         RUNNABLE   0           0:0        false      false
52         nioEventLoopGroup-2-5             system                10         RUNNABLE   0           0:0        false      false
27         nioEventLoopGroup-3-1             system                10         RUNNABLE   0           0:0        false      false
28         pool-1-thread-1                   system                5          TIMED_WAIT 0           0:0        false      false
29         pool-2-thread-1                   system                5          WAITING    0           0:0        false      false
Affect(row-cnt:0) cost in 119 ms.
3.1.5. Analyze Thread Dumps with Java Thread Analyzer (online)
An online tool to analyze thread dumps:
3.1.6. Capture CPU Information and Thread-Dumps over Time
We’re creating cpu-usage-logs and thread-dumps each 10 seconds six times.
See Workflow: High CPU Usage for more detailed information how to use this information to detect CPU intensive threads.
APP_PID=8726
for i in $(seq 6); do top -b -H -p $APP_PID -n 1 > app_cpu_usage.`date +%s`.txt; jstack $APP_PID > app_threads.`date +%s`.txt; sleep 10; done
% ls -1
app_cpu_usage.1518772437.txt
app_cpu_usage.1518772448.txt
app_cpu_usage.1518772458.txt
app_cpu_usage.1518772469.txt
app_cpu_usage.1518772479.txt
app_cpu_usage.1518772489.txt
app_threads.1518772438.txt
app_threads.1518772448.txt
app_threads.1518772458.txt
app_threads.1518772469.txt
app_threads.1518772479.txt
app_threads.1518772489.txt
3.2. Create HPROF Heap Dump
3.2.2. HPROF Features
java -agentlib:hprof=help

     HPROF: Heap and CPU Profiling Agent (JVMTI Demonstration Code)

hprof usage: java -agentlib:hprof=[help]|[<option>=<value>, ...]

Option Name and Value  Description                    Default
---------------------  -----------                    -------
heap=dump|sites|all    heap profiling                 all
cpu=samples|times|old  CPU usage                      off
monitor=y|n            monitor contention             n
format=a|b             text(txt) or binary output     a
file=<file>            write data to file             java.hprof[{.txt}]
net=<host>:<port>      send data over a socket        off
depth=<size>           stack trace depth              4
interval=<ms>          sample interval in ms          10
cutoff=<value>         output cutoff point            0.0001
lineno=y|n             line number in traces?         y
thread=y|n             thread in traces?              n
doe=y|n                dump on exit?                  y
msa=y|n                Solaris micro state accounting n
force=y|n              force output to <file>         y
verbose=y|n            print messages about dumps     y

Obsolete Options
----------------
gc_okay=y|n

Examples
--------
  - Get sample cpu information every 20 millisec, with a stack depth of 3:
      java -agentlib:hprof=cpu=samples,interval=20,depth=3 classname
  - Get heap usage information based on the allocation sites:
      java -agentlib:hprof=heap=sites classname

Notes
-----
  - The option format=b cannot be used with monitor=y.
  - The option format=b cannot be used with cpu=old|times.
  - Use of the -Xrunhprof interface can still be used, e.g.
       java -Xrunhprof:[help]|[<option>=<value>, ...]
    will behave exactly the same as:
       java -agentlib:hprof=[help]|[<option>=<value>, ...]

Warnings
--------
  - This is demonstration code for the JVMTI interface and use of BCI,
    it is not an official product or formal part of the JDK.
  - The -Xrunhprof interface will be removed in a future release.
  - The option format=b is considered experimental, this format may change
    in a future release.
3.2.3. Dump with jmap
jmap -dump:format=b,file=/tmp/heap.hprof 23813.2.4. Dump with jcmd
jcmd <pid/main class> GC.heap_dump filename=heap.hprof3.2.5. Dump on OutOfMemoryError
Start the Java application with the following parameter
-XX:+HeapDumpOnOutOfMemoryError3.3. Create Heap Histogram
jcmd <pid/main class> GC.class_histogram > heap_histogram.txtjmap -histo pid > heap_histogram.txt3.4. Java Flight Recorder (JFR) Recording Runtime Information
More information about using JFR and Java Mission Control (JMC) here:
3.4.1. Start java app with commercial features unlocked and flight recorder activated:
-XX:+UnlockCommercialFeatures -XX:+FlightRecorder3.4.2. Check if JVM has commercial features activated
jcmd PID VM.check_commercial_features3.4.3. Unlock commercial features
jcmd PID VM.unlock_commercial_features3.4.4. Record for one minute
jcmd PID JFR.start duration=60s filename=one-minute-live-recording.jfr3.5. jhat server
| Using jhat with large heap dumps consumes huge amounts of memory. Use Eclipse Memory Analyzer (MAT) instead, more features, less memory consumption. |
jhat -port 7401 -J-Xmx4G heap.bin3.6. JVM Memory Statistics
3.6.1. JVM Memory Types
- Heap
-
Class instantiations/objects are stored here
- Thread stacks
-
A thread has its own call stack. Primitive local variables and object references are stored there along with the call stack (list of method invocations) itself. The stack is cleaned up as stack frames move out of context so there is no GC performed here.
- Metaspace
-
Class definitions of the objects is stored here
- Code cache
-
Stores native code from the JIT compiler
- Buffer pools
-
Allocated buffers outside of the heap (often used by libraries for performance reasons). Buffer pools can be used to share memory between Java code and native code, or map regions of a file into memory.
- OS memory
-
OS keeps heap and stacks for a Java process independent of the heap and stacks managed by the JVM itself. A small amount of memory is also consumed for each native library loaded.
3.6.2. Common Heap related Switches
| Parameter | Description |
|---|---|
-Xms |
Initial heap size for when the JVM starts. |
-Xmx |
Maximum heap size. |
-Xmn |
Size of the Young Generation. |
-XX:PermSize |
Starting size of the Permanent Generation. |
-XX:MaxPermSize |
Maximum size of the Permanent Generation |
Heap Region Usage (jstat)
jstat -gcutil ID3.7. Garbage Collection (GC)
|
Reading Recommendation
A lot of in-depth articles can be found in Plumbr’s Garbage Collection Handbook.
|
3.7.1. Garbage Collection Roots
Garbage Collection Roots (GCRoots) are the starting point for the Garbage Collector during the Mark phase to detect reachable objects.
- GCRoots
-
-
Local variables
-
Active threads
-
Static fields
-
JNI references
-
In the Sweep phase the Garbage Collector makes sure that the space used by non-reachable objects is freed.
Afterwards some Garbage Collectors may run a compact phase to optimize the heap structures.
3.7.2. Garbage Collector Types
More detailed information: Plumbr - GC Algorithms: Implementations
Serial GC
-
mark-copy for young-generation, mark-sweep-compact for old generation
-
simplest GC, uses only one thread
-
freezes all application threads when running
-
don’t use it, especially not for multi-threaded environments
Enable this garbage collector by adding the following vm parameter:
-XX:+UseSerialGCParallel GC
-
mark-copy for young generation, mark-sweep-compact for old generation
-
young and old collections trigger stop-the-world-events
-
collectors use multiple threads to mark-copy/mark-sweep-compact
The Parallel GC is activated by adding the following vm parameter:
-XX:+UseParallelGCConcurrent Mark & Sweep GC (CMS)
The Concurrent Mark Sweeep GC is activated by adding the following vm parameter:
-
parallel stop-the-world mark-copy for young-generation, mostly-concurrent mark-sweep for old generation
-
designed to avoid long pauses when collecting the old generation, it does not compact old gen but uses free lists to manage reclaimed space
-XX:+UseConcMarkSweepGCGarbage First (G1) GC
-
aims to make duration and distribution of stop-the-world-pauses predictable and configurable
-
heap is split into a number of smaller heap regions where each region may be an Eden, Survivor or Old region
-
all Eden+Survivor regions = Young Generation, all Old regions = Old Generation
Activate this Garbage Collector by adding the following vm parameter:
-XX:+UseG1GC3.8. Garbage Collection Logging
By adding the following JVM parameters:
-verbose:gc or the -XloggcThe following additional parameters add helpful timestamps and more detailed information..
-XX:+PrintGCDetails -XX:+PrintGCDateStamps -XX:+PrintGCTimeStampsIn addition we may configure how to write the gc log files .. e.g.:
-Xloggc:/path/to/gc-stats.log -XX:+UseGCLogFileRotation -XX:NumberOfGCLogFiles=5 -XX:GCLogFileSize=2M -XX:-PrintGCDetails -XX:+PrintGCDateStamps -XX:+PrintGCTimeStamps -XX:-PrintTenuringDistribution3.9. Analyzing Garbage Collection
Analyzing the garbage collection (GC) logs can give us some details e.g.:
-
When did full GCs run?
-
When did scavenge or young generation GCs run?
-
How many scavenge and gulls GCs ran (in which interval)?
-
After GC, how much memory was reclaimed in Young and Old generations?
-
How long did GC run?
-
What was the total allocated memory in each generation?
3.9.1. Understanding the GC Log Format
|
Allocation Failure
Log entries stating a "GC (Allocation Failure)" do not necessarily identify an error but state that no more space is left in Eden to allocate objects and therefore it’s a cause of a normal GC Cycle to kick. Older JMVs did not log the cause of minor GC cycles so that the log files may differ between JVM versions. |
Java HotSpot(TM) 64-Bit Server VM (25.151-b12) for linux-amd64 JRE (1.8.0_151-b12), built on Sep  5 2017 19:20:58 by "java_re" with gcc 4.3.0 20080428 (Red Hat 4.3.0-8)
Memory: 4k page, physical 32598036k(20587788k free), swap 33205756k(33205756k free)
CommandLine flags: -XX:InitialHeapSize=521568576 -XX:MaxHeapSize=8345097216 -XX:+PrintGC -XX:+PrintGCDateStamps -XX:+PrintGCDetails -XX:+PrintGCTimeStamps -XX:+UseCompressedClassPo
inters -XX:+UseCompressedOops -XX:+UseParallelGC
2018-03-21T10:39:18.793+0100: 650,456: [GC (Allocation Failure) [PSYoungGen: 128000K->7681K(148992K)] 128000K->7697K(488960K), 0,0073382 secs] [Times: user=0,02 sys=0,00, real=0,01
 secs]
2018-03-21T10:39:20.036+0100: 651,699: [GC (Allocation Failure) [PSYoungGen: 135681K->3936K(148992K)] 135697K->3960K(488960K), 0,0055688 secs] [Times: user=0,03 sys=0,00, real=0,01
 secs]
2018-03-21T10:39:21.021+0100: 652,684: [GC (Allocation Failure) [PSYoungGen: 131936K->4000K(148992K)] 131960K->4032K(488960K), 0,0043573 secs] [Times: user=0,02 sys=0,00, real=0,00
 secs]
2018-03-21T10:39:21.979+0100: 653,642: [GC (Allocation Failure) [PSYoungGen: 132000K->4000K(148992K)] 132032K->4040K(488960K), 0,0045307 secs] [Times: user=0,02 sys=0,00, real=0,01
 secs]
2018-03-21T10:39:22.958+0100: 654,621: [GC (Allocation Failure) [PSYoungGen: 132000K->4064K(129024K)] 132040K->4112K(468992K), 0,0046371 secs] [Times: user=0,02 sys=0,00, real=0,01
 secs]
2018-03-21T10:39:23.874+0100: 655,537: [GC (Allocation Failure) [PSYoungGen: 128992K->4032K(125952K)] 129040K->4088K(465920K), 0,0053952 secs] [Times: user=0,01 sys=0,00, real=0,00
 secs]
 [..]
Inspecting a single line, we may identify the different parts of the log file.
2018-03-21T10:39:18.793+0100: 650,456: [GC (Allocation Failure) [PSYoungGen: 128000K->7681K(148992K)] 128000K->7697K(488960K), 0,0073382 secs] [Times: user=0,02 sys=0,00, real=0,01
secs]-
2018-03-21T10:39:18.793+0100: The GC event’s start time. -
650,456: The GC event’s start time relative to the JVM startup time. -
GCDistinguishing flag between minor and full GC. In this case, it’s a minor GC (otherwise it would have beenFull GC) -
Allocation Failure: The cause of the collection. In this case, the young gen has no more space to allocate objects. -
PSYoungGen: The target of the GC, the Young Generation.. -
128000K→7681K: The space reduction of the Young Space after the GC. -
(148992K): The Young Generation’s total size. -
128000K→7697K: Total heap before and after GC -
(488960K): Total available heap -
0,0073382 secs: Duration of GC event in seconds -
[Times: user=0,02 sys=0,00, real=0,01secs]: The GC event’s duration, measured as:-
user: Amount of CPU time spent in user-mode code (outside the kernel) -
sys: Time spent in OS/Kernel calls or waiting for system event -
real: Wall clock time - time from start to finish (all elapsed time including time slices used by other processes and time spent blocked e.g. waiting for IO)
-
3.9.2. jtune
A Python based CLI tool to analyze GC log files or GCs at runtime.
pip install jtune

jtune -c 40 -p 25815
3.9.3. GCPlot
Is basically a web application that may be run in the local environment e.g. using Docker.
docker run -d -p 80:80 gcplot/gcplotAfterwards we may access GCPlot as a web application running on http://localhost.
Username and password is admin.
3.9.4. Universal GC Log Analyzer
An online tool that allows to analyze uploaded garbage collection logs.
3.9.5. HPjmeter
A feature-rich analyzing tool from Hewlett Packard.
You need to have/create a HPE Passport account to download this tool.
|
3.9.6. Garbage Collection Statistics Summary (jstat)
jstat -gcutil PID3.9.8. Record GC Stats 20 times each 10 seconds (jstat)
jstat -gcutil -t PID 10s 203.10. HotSpot / JIT Compiler
3.10.1. Write JIT Compiler Output to Log File
java -XX:+UnlockDiagnosticVMOptions -XX:+LogCompilation -XX:LogFile=jit.log com.hascode.MyClass3.10.2. Compiler Flags Explained
b    Blocking compiler (always set for client)
*    Generating a native wrapper
%    On stack replacement (where the compiled code is running)
!    Method has exception handlers
s    Method declared as synchronized
n    Method declared as native
made non entrant    compilation was wrong/incomplete, no future callers will use this version
made zombie code is not in use and ready for GC3.10.3. Print short Compilation Summary
jstat -printcompilation pid3.10.4. GUI Inspector (JITWatch)
Allows to inspect JIT compilations and has a sandbox feature to test code snippets for JIT optimization.
-
Download the source from GitHub
-
Run
mvn clean compile test exec:java
3.11. Code Cache Tuning
| Possible problem might be indicated by error log entries (e.g. catalina.out) stating that the 'CodeCache is full' and the 'compiler has been disabled'. |
Example:
Java HotSpot(TM) 64-Bit Server VM warning: CodeCache is full. Compiler has been disabled.
Java HotSpot(TM) 64-Bit Server VM warning: Try increasing the code cache size using -XX:ReservedCodeCacheSize=
CodeCache: size=245760Kb used=243892Kb max_used=243931Kb free=1867Kb
 bounds [0x00007faa3b170000, 0x00007faa4a170000, 0x00007faa4a170000]
 total_blobs=45719 nmethods=44096 adapters=1528
compilation: disabled (not enough contiguous free space left)| Solution is to assign more space for the code cache and to activate flushing. This may be done using -XX:ReservedCodeCacheSize and -XX:+UseCodeCacheFlushing. |
JVM Parameters:
-XX:ReservedCodeCacheSize=384m -XX:+UseCodeCacheFlushing3.11.1. Print System Defaults
To find the default size of the code cache and if flushing is enabled.
% java -XX:+PrintFlagsFinal | grep CodeCache
    uintx CodeCacheExpansionSize                    = 65536                               {pd product}
    uintx CodeCacheMinimumFreeSpace                 = 512000                              {product}
    uintx InitialCodeCacheSize                      = 2555904                             {pd product}
     bool PrintCodeCache                            = false                               {product}
     bool PrintCodeCacheOnCompilation               = false                               {product}
    uintx ReservedCodeCacheSize                     = 251658240                           {pd product}
     bool UseCodeCacheFlushing                      = true                                {product}
3.12. Native Memory
3.12.1. Tracking Native Memory
Activate the JVM native memory tracking feature:
-XX:NativeMemoryTracking=detail -XX:+UnlockDiagnosticVMOptions -XX:+PrintNMTStatistics3.12.2. Print Native Memory Used by Process (jcmd)
jcmd <PID> VM.native_memory summary
14321:

Native Memory Tracking:

Total: reserved=9861214KB, committed=902706KB
-                 Java Heap (reserved=8151040KB, committed=509952KB)
                            (mmap: reserved=8151040KB, committed=509952KB)

-                     Class (reserved=1070349KB, committed=23565KB)
                            (classes #2382)
                            (malloc=9485KB #1932)
                            (mmap: reserved=1060864KB, committed=14080KB)

-                    Thread (reserved=49556KB, committed=49556KB)
                            (thread #49)
                            (stack: reserved=49344KB, committed=49344KB)
                            (malloc=155KB #250)
                            (arena=56KB #96)

-                      Code (reserved=250177KB, committed=4413KB)
                            (malloc=577KB #1505)
                            (mmap: reserved=249600KB, committed=3836KB)

-                        GC (reserved=308187KB, committed=283315KB)
                            (malloc=10383KB #135)
                            (mmap: reserved=297804KB, committed=272932KB)

-                  Compiler (reserved=148KB, committed=148KB)
                            (malloc=18KB #78)
                            (arena=131KB #3)

-                  Internal (reserved=27045KB, committed=27045KB)
                            (malloc=27013KB #4122)
                            (mmap: reserved=32KB, committed=32KB)

-                    Symbol (reserved=3987KB, committed=3987KB)
                            (malloc=2764KB #16693)
                            (arena=1223KB #1)

-    Native Memory Tracking (reserved=529KB, committed=529KB)
                            (malloc=112KB #1769)
                            (tracking overhead=416KB)

-               Arena Chunk (reserved=196KB, committed=196KB)
                            (malloc=196KB)
jcmd does not capture direct or mapped buffer pools.
|
3.12.3. Detecting Native Memory Leaks
-
Start the JVM with
summaryordetailtracking enabled:-XX:NativeMemoryTracking=summaryor
-XX:NativeMemoryTracking=detail -
Establish a baseline used for later for comparison
jcmd <pid> VM.native_memory baseline -
Monitor memory changes with
jcmd <PID> VM.native_memory detail.diff
<PID>:

Native Memory Tracking:

Total: reserved=9863326KB +18KB, committed=903286KB +82KB

-                 Java Heap (reserved=8151040KB, committed=509952KB)
                            (mmap: reserved=8151040KB, committed=509952KB)

-                     Class (reserved=1072398KB, committed=23822KB)
                            (classes #2383 +1)
                            (malloc=9486KB #1954 -19)
                            (mmap: reserved=1062912KB, committed=14336KB)

-                    Thread (reserved=49556KB, committed=49556KB)
                            (thread #49)
                            (stack: reserved=49344KB, committed=49344KB)
                            (malloc=155KB #250)
                            (arena=56KB #96)

-                      Code (reserved=250201KB -8KB, committed=4697KB +56KB)
                            (malloc=601KB -8KB #1523 -16)
                            (mmap: reserved=249600KB, committed=4096KB +64KB)

-                        GC (reserved=308187KB, committed=283315KB)
                            (malloc=10383KB #135)
                            (mmap: reserved=297804KB, committed=272932KB)

-                  Compiler (reserved=148KB, committed=148KB)
                            (malloc=17KB #75)
                            (arena=131KB #3)

-                  Internal (reserved=27047KB +1KB, committed=27047KB +1KB)
                            (malloc=27015KB +1KB #4127 +4)
                            (mmap: reserved=32KB, committed=32KB)

-                    Symbol (reserved=3995KB, committed=3995KB)
                            (malloc=2772KB #16694)
                            (arena=1223KB #1)

-    Native Memory Tracking (reserved=558KB +26KB, committed=558KB +26KB)
                            (malloc=136KB +21KB #2107 +309)
                            (tracking overhead=422KB +4KB)

-               Arena Chunk (reserved=197KB, committed=197KB)
                            (malloc=197KB)

[0x00007f97eb193f05] CodeBlob::set_oop_maps(OopMapSet*)+0xe5
[0x00007f97eb19444b] CodeBlob::CodeBlob(char const*, CodeBuffer*, int, int, int, int, OopMapSet*)+0xcb
[0x00007f97eb6069ee] nmethod::nmethod(Method*, int, int, int, CodeOffsets*, int, DebugInformationRecorder*, Dependencies*, CodeBuffer*, int, OopMapSet*, ExceptionHandlerTable*, ImplicitExceptionTable*, AbstractCompiler*, int)+0x4e
[0x00007f97eb607389] nmethod::new_nmethod(methodHandle, int, int, CodeOffsets*, int, DebugInformationRecorder*, Dependencies*, CodeBuffer*, int, OopMapSet*, ExceptionHandlerTable*, ImplicitExceptionTable*, AbstractCompiler*, int)+0x289
                             (malloc=551KB -8KB #1004 -16)

[0x00007f97eb580a50] MallocSiteTable::new_entry(NativeCallStack const&)+0x0
[0x00007f97eb580e20] MallocSiteTable::lookup_or_add(NativeCallStack const&, unsigned long*, unsigned long*)+0x0
[0x00007f97eb581080] MallocSiteTable::allocation_at(NativeCallStack const&, unsigned long, unsigned long*, unsigned long*)+0x0
                             (malloc=109KB +3KB #1749 +42)

[0x00007f97eb59ca53] MemBaseline::aggregate_virtual_memory_allocation_sites()+0x173
[0x00007f97eb59ccd8] MemBaseline::baseline_allocation_sites()+0x1d8
[0x00007f97eb59d355] MemBaseline::baseline(bool)+0x635
[0x00007f97eb60cd98] NMTDCmd::execute(DCmdSource, Thread*)+0x178
                             (malloc=1KB +1KB #17 +17)

[..]
3.13. Eclipse Memory Analyzer (MAT)
Reads in HPROF heap dumps and stores them in an index. In contrast to other tools this fact avoids the allocation of (n * heap-dump-size) memory in the RAM which is significant when trying to process large heap dumps.
- MAT Project/Download Site
3.13.1. Dominator Tree
|
Dominator
An object x dominates an object y if every path in the object graph from the start/root node to y must pass through x.
|
Memory Analyzer provides a dominator tree of the object graph. The transformation of the object reference graph into a dominator tree allows you to easily identify the biggest chunks of retained memory and the keep-alive dependencies among objects. Bellow is an informal definition of the terms.
3.13.2. Shallow vs Retained Heap
Shallow heap is the memory consumed by one object. An object needs 32 or 64 bits (depending on the OS architecture) per reference, 4 bytes per Integer, 8 bytes per Long, etc. Depending on the heap dump format the size may be adjusted (e.g. aligned to 8, etc…) to model better the real consumption of the VM.
Retained set of X is the set of objects which would be removed by GC when X is garbage collected.
Retained heap of X is the sum of shallow sizes of all objects in the retained set of X, i.e. memory kept alive by X.
Generally speaking, shallow heap of an object is its size in the heap and retained size of the same object is the amount of heap memory that will be freed when the object is garbage collected.
3.13.3. Garbage Collection Roots (gcroots)
Gcroots are objects accessible from outside the heap - these may be ..
- System Class
Class loaded by bootstrap/system class loader. For example, everything from the rt.jar like java.util.* .
- JNI Local
Local variable in native code, such as user defined JNI code or JVM internal code.
- JNI Global
Global variable in native code, such as user defined JNI code or JVM internal code.
- Thread Block
Object referred to from a currently active thread block.
- Thread
A started, but not stopped, thread.
- Busy Monitor
Everything that has called wait() or notify() or that is synchronized. For example, by calling synchronized(Object) or by entering a synchronized method. Static method means class, non-static method means object.
- Java Local
Local variable. For example, input parameters or locally created objects of methods that are still in the stack of a thread.
- Native Stack
In or out parameters in native code, such as user defined JNI code or JVM internal code. This is often the case as many methods have native parts and the objects handled as method parameters become GC roots. For example, parameters used for file/network I/O methods or reflection.
- Finalizable
An object which is in a queue awaiting its finalizer to be run.
- Unfinalized
An object which has a finalize method, but has not been finalized and is not yet on the finalizer queue.
- Unreachable
An object which is unreachable from any other root, but has been marked as a root by MAT to retain objects which otherwise would not be included in the analysis.
- Java Stack Frame
A Java stack frame, holding local variables. Only generated when the dump is parsed with the preference set to treat Java stack frames as objects.
- Unknown
An object of unknown root type. Some dumps, such as IBM Portable Heap Dump files, do not have root information. For these dumps the MAT parser marks objects which are have no inbound references or are unreachable from any other root as roots of this type. This ensures that MAT retains all the objects in the dump.
3.13.4. Histogram
The histogram shows the number of instances of a particular class and its memory consumption. We may group the view’s entries by classloader or package (and filter by package) to gain more insights.
When observing the histogram, native structures like String, Object[] and char are seldom the problem’s indicator but large collections or custom classes may be.
3.13.5. Leak Suspect Report
The leak suspect report may help identifying possible memory leaks as it scans the heap dump for large memory chunks and checks what keeps these chunks alive.
It also generates some nice pie charts ;)
3.13.6. Duplicate Classes Report
Error may occur if an application loads different version of the same library.
The Duplicate Classes Report searches for classes existing multiple times in the heap and lists them with their corresponding classloader.
3.14. Hypothesis Driven Workflows
| In case of a resource exhaustion on the affected system, we need to track down what is affected (RAM, disk-space, IO-Handle-Limits, etc..) and then to investigate how our Java application causes or affects this situation. |
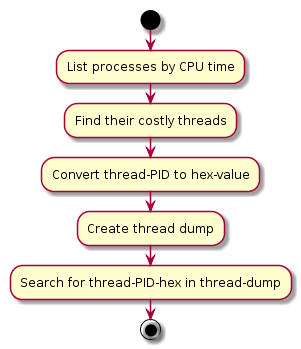
3.14.1. High CPU Usage
The following workflow allows us to identify the Java threads causing high CPU usage.
-
First of all we need to know which Java process has high CPU time:
The following command lists processes, sorts them by their CPU time and greps for lines containing java:
ps -eLf --sort -pcpu|grep java -
Now we’ve got the
pidof the CPU using process, let’s say it is 123456.We now want to know which thread of this process uses many CPU resources.
-
One way to look at a process' threads is using
pslike this:ps -Lp 123456Using
topis an option, too:top -H -p 123456 -
Now we should have one or more
pidsof the suspicious threads. -
If we haven’t take a thread dump before, we should do this now using
jstack:jstack PID > thread.dumpA better alternative is using
jcmd(offers deadlock detection):jcmd PID Thread.print > thread.dumpTo record some thread-dumps and cpu-logs over time, I have added a little bash script here: Capture CPU Information and Thread-Dumps over Time.
-
Now we need to convert the suspicious thread’s
PIDto the hex-format so that we can search for these threads in the generated thread dumps.The following commands converts the
PIDto the hex-format.% printf 0x%x 8726 0x2216With this hex-id we can now search in the thread-dumps and identify the exact threads.
3.14.2. Out of Memory Errors / High Memory Usage
-
First of all we need to create a HPROF heap dump. For more information how to create these dumps, see Create HPROF Heap Dump.
There are different tools to read in the generated heap dump, but many of these tools require the 1.5x size of the dump of memory. This may be a problem for larger heap dumps that exceed your workstation’s RAM.
Common open-source tools for heap dump analysis are:
-
visualvm -
jmc(Java Mission Control)
The Eclipse Memory Analyzer (MAT) has the advantage of reading in the heap information in an internal index and therefore does not consume as much RAM as other tools and may be used for large heap dumps.
Please refer to the chapter "Eclipse Memory Analyzer (MAT)" for more detailed information about its capabilities and reports.
3.15. JVM Unified Logging
With Java 9, JEP-158 added unified logging for the Java ™ Virtual Machine.
By adding a vm parameter this allows us to specify ..
-
what to log: messages may be selected by tag or log-level
-
the log information: the output may be configured to include information like process-ids, timestamps
-
where to log: writing the output STDOUT, STDERR or a file
Unified Logging is activated by adding the following JVM parameter:
-XlogMore detailed information in general can be found in Oracle’s Java 9 documentation.
3.15.1. Filtering JVM Logs
The following shortened output gives a good example for the different event labels and log-levels.
$ java -Xlog -version
[0.006s][info][os] SafePoint Polling address: 0x00007f3f9bcf1000
[0.006s][info][os] Memory Serialize Page address: 0x00007f3f9bcf0000
[0.007s][info][os,thread] Capturing initial stack in user thread: req. size: 1024K, actual size: 1024K, top=0x00007ffd552fc000, bottom=0x00007ffd551fc000
[0.007s][info][os       ] HotSpot is running with glibc 2.23, NPTL 2.23
[0.007s][info][biasedlocking] Aligned thread 0x00007f3f94013550 to 0x00007f3f94013800
[0.007s][info][os,thread    ] Thread attached (tid: 2571, pthread id: 139911173547776).
[0.008s][info][class,path   ] bootstrap loader class path=/data/app/jdk-9/lib/modules
[0.008s][info][class,path   ] classpath:
[0.008s][info][class,path   ] opened: /data/app/jdk-9/lib/modules
[0.008s][info][class,load   ] opened: /data/app/jdk-9/lib/modules
[0.008s][info][pagesize     ] CodeHeap 'non-nmethods':  min=2496K max=5700K base=0x00007f3f7ba35000 page_size=4K size=5700K
[0.008s][info][pagesize     ] CodeHeap 'profiled nmethods':  min=2496K max=120028K base=0x00007f3f7bfc6000 page_size=4K size=120028K
[0.008s][info][pagesize     ] CodeHeap 'non-profiled nmethods':  min=2496K max=120032K base=0x00007f3f834fd000 page_size=4K size=120032K
[0.008s][info][os,cpu       ] CPU:total 8 (initial active 8) (4 cores per cpu, 2 threads per core) family 6 model 58 stepping 9, cmov, cx8, fxsr, mmx, sse, sse2, sse3, ssse3, sse4.1, sse4.2, popcnt, avx, aes, clmul, erms, ht, tsc, tscinvbit, tscinv
[0.025s][info][os,cpu       ] CPU Model and flags from /proc/cpuinfo:
[0.025s][info][os,cpu       ] model name        : Intel(R) Core(TM) i7-3820QM CPU @ 2.70GHz
[0.026s][info][os,cpu       ] flags             : fpu vme de pse tsc msr pae mce cx8 apic sep mtrr pge mca cmov pat pse36 clflush dts acpi mmx fxsr sse sse2 ss ht tm pbe syscall nx rdtscp lm constant_tsc arch_perfmon pebs bts rep_good nopl xtopology nonstop_tsc cpuid aperfmperf pni pclmulqdq dtes64 monitor ds_cpl vmx smx est tm2 ssse3 cx16 xtpr pdcm pcid sse4_1 sse4_2 x2apic popcnt tsc_deadline_timer aes xsave avx f16c rdrand lahf_lm cpuid_fault epb pti retpoline spec_ctrl tpr_shadow vnmi flexpriority ept vpid fsgsbase smep erms xsaveopt dtherm ida arat pln pts
[0.026s][info][startuptime  ] StubRoutines generation 1, 0.0002880 secs
[0.026s][info][gc,heap      ] Heap region size: 2M
[..]
[0.055s][info][biasedlocking] Aligned thread 0x00007f3f942492f0 to 0x00007f3f94249800
[0.055s][info][os,thread    ] Thread started (pthread id: 139908884715264, attributes: stacksize: 1024k, guardsize: 0k, detached).
[0.055s][info][os,thread    ] Thread is alive (tid: 2595, pthread id: 139908884715264).
[..]
[0,102s][info][module,load  ] java.xml location: jrt:/java.xml
[..]
[0,106s][info][class,load   ] java.util.concurrent.CopyOnWriteArrayList source: jrt:/java.base
[0,107s][info][class,init   ] 360 Initializing 'java/util/concurrent/CopyOnWriteArrayList'(no method) (0x00000007c004fa70)
[..]
[0,110s][info][safepoint,cleanup ] purging class loader data graph, 0,0000001 secs
[0,110s][info][os,thread         ] Thread finished (tid: 2593, pthread id: 139908886820608).
Filtering by Tag
Using the example above we now would like to filter by os tagged jvm messages.
- Available tags are
-
-
add
-
age
-
alloc
-
annotation
-
aot
-
arguments
-
attach
-
barrier
-
biasedlocking
-
blocks
-
bot
-
breakpoint
-
bytecode
-
census
-
class
-
classhisto
-
cleanup
-
compaction
-
comparator
-
constraints
-
constantpool
-
coops
-
cpu
-
cset
-
data
-
defaultmethods
-
dump
-
ergo
-
event
-
exceptions
-
exit
-
fingerprint
-
freelist
-
gc
-
hashtables
-
heap
-
humongous
-
ihop
-
iklass
-
init
-
itables
-
jfr
-
jni
-
jvmti
-
liveness
-
load
-
loader
-
logging
-
mark
-
marking
-
metadata
-
metaspace
-
method
-
mmu
-
modules
-
monitorinflation
-
monitormismatch
-
nmethod
-
normalize
-
objecttagging
-
obsolete
-
oopmap
-
os
-
pagesize
-
parser
-
patch
-
path
-
phases
-
plab
-
preorder
-
promotion
-
protectiondomain
-
purge
-
redefine
-
ref
-
refine
-
region
-
remset
-
resolve
-
safepoint
-
scavenge
-
scrub
-
setting
-
stackmap
-
stacktrace
-
stackwalk
-
start
-
startuptime
-
state
-
stats
-
stringdedup
-
stringtable
-
subclass
-
survivor
-
sweep
-
system
-
task
-
thread
-
time
-
timer
-
tlab
-
unload
-
update
-
verification
-
verify
-
vmoperation
-
vtables
-
workgang
-
We may specify one or more tags by adding them to the JVM parameter like this:
% java -Xlog:os -version
[0.007s][info][os] SafePoint Polling address: 0x00007fe6f1d9d000
[0.007s][info][os] Memory Serialize Page address: 0x00007fe6f1d9c000
[0.007s][info][os] HotSpot is running with glibc 2.23, NPTL 2.23
openjdk version "9"
OpenJDK Runtime Environment (build 9+181)
OpenJDK 64-Bit Server VM (build 9+181, mixed mode)
Another example using multiple tags, os and cpu:
% java -Xlog:os+cpu -version
[0.009s][info][os,cpu] CPU:total 8 (initial active 8) (4 cores per cpu, 2 threads per core) family 6 model 58 stepping 9, cmov, cx8, fxsr, mmx, sse, sse2, sse3, ssse3, sse4.1, sse4.2, popcnt, avx, aes, clmul, erms, ht, tsc, tscinvbit, tscinv
[0.026s][info][os,cpu] CPU Model and flags from /proc/cpuinfo:
[0.026s][info][os,cpu] model name       : Intel(R) Core(TM) i7-3820QM CPU @ 2.70GHz
[0.027s][info][os,cpu] flags            : fpu vme de pse tsc msr pae mce cx8 apic sep mtrr pge mca cmov pat pse36 clflush dts acpi mmx fxsr sse sse2 ss ht tm pbe syscall nx rdtscp lm constant_tsc arch_perfmon pebs bts rep_good nopl xtopology nonstop_tsc cpuid aperfmperf pni pclmulqdq dtes64 monitor ds_cpl vmx smx est tm2 ssse3 cx16 xtpr pdcm pcid sse4_1 sse4_2 x2apic popcnt tsc_deadline_timer aes xsave avx f16c rdrand lahf_lm cpuid_fault epb pti retpoline spec_ctrl tpr_shadow vnmi flexpriority ept vpid fsgsbase smep erms xsaveopt dtherm ida arat pln pts
openjdk version "9"
OpenJDK Runtime Environment (build 9+181)
OpenJDK 64-Bit Server VM (build 9+181, mixed mode)|
The tags specified as a filter must exactly match the tags assigned to the message! Therefore To show every message tagged with "os", we may use the following wildcard expression: |
Several selectors may be applied, separated by a comma:
% java -Xlog:os,os+cpu -version
[0.008s][info][os] SafePoint Polling address: 0x00007f823b8e6000
[0.008s][info][os] Memory Serialize Page address: 0x00007f823b8e5000
[0.008s][info][os] HotSpot is running with glibc 2.23, NPTL 2.23
[0.011s][info][os,cpu] CPU:total 8 (initial active 8) (4 cores per cpu, 2 threads per core) family 6 model 58 stepping 9, cmov, cx8, fxsr, mmx, sse, sse2, sse3, ssse3, sse4.1, sse4.2, popcnt, avx, aes, clmul, erms, ht, tsc, tscinvbit, tscinv
[0.030s][info][os,cpu] CPU Model and flags from /proc/cpuinfo:
[0.030s][info][os,cpu] model name       : Intel(R) Core(TM) i7-3820QM CPU @ 2.70GHz
[0.030s][info][os,cpu] flags            : fpu vme de pse tsc msr pae mce cx8 apic sep mtrr pge mca cmov pat pse36 clflush dts acpi mmx fxsr sse sse2 ss ht tm pbe syscall nx rdtscp lm constant_tsc arch_perfmon pebs bts rep_good nopl xtopology nonstop_tsc cpuid aperfmperf pni pclmulqdq dtes64 monitor ds_cpl vmx smx est tm2 ssse3 cx16 xtpr pdcm pcid sse4_1 sse4_2 x2apic popcnt tsc_deadline_timer aes xsave avx f16c rdrand lahf_lm cpuid_fault epb pti retpoline spec_ctrl tpr_shadow vnmi flexpriority ept vpid fsgsbase smep erms xsaveopt dtherm ida arat pln pts
openjdk version "9"
OpenJDK Runtime Environment (build 9+181)
OpenJDK 64-Bit Server VM (build 9+181, mixed mode)
Filtering by Log-Level
We may specify the designated log-level for filtering messages.
- Available log-levels are
-
-
info
-
debug
-
off
-
trace
-
warning
-
error
-
The first example only displays messages that are warnings - luckily there are no warnings ;)
% java -Xlog:all=warning --version
openjdk 9
OpenJDK Runtime Environment (build 9+181)
OpenJDK 64-Bit Server VM (build 9+181, mixed mode)
The following example displays all debug messages:
% java -Xlog:all=debug
[0.001s][debug][os] Initial active processor count set to 8
[0.006s][info ][os] SafePoint Polling address: 0x00007fe6713f0000
[0.006s][info ][os] Memory Serialize Page address: 0x00007fe6713ef000
[0.007s][info ][os,thread] Capturing initial stack in user thread: req. size: 1024K, actual size: 1024K, top=0x00007fff13978000, bottom=0x00007fff13878000
[0.007s][info ][os       ] HotSpot is running with glibc 2.23, NPTL 2.23
[..]
Filtering by Tag and Log-Level
We may specify the designated log-level for specific tagged messages.
In the following example, we’re showing only messages tagged with os and having a log-level debug:
% java -Xlog:os=debug --version                                                                                                                                                 1 ↵
[0.001s][debug][os] Initial active processor count set to 8
[0.007s][info ][os] SafePoint Polling address: 0x00007fe79010b000
[0.007s][info ][os] Memory Serialize Page address: 0x00007fe79010a000
[0.007s][info ][os] HotSpot is running with glibc 2.23, NPTL 2.23
openjdk 9
OpenJDK Runtime Environment (build 9+181)
OpenJDK 64-Bit Server VM (build 9+181, mixed mode)
3.15.2. Logging to STDOUT, STDERR or a File
We may specify where to log by appending one of the possible three locations to the parameter list preceded by colon:
-
stdout: wrinting to STDOUT -
stderr: writing to STDERR -
file=/path/to/file: writing to the file /path/to/file
The following example logs all warnings to STDERR:
% java -Xlog:all=warning:stderr --versionIn this example, all os tagged debug messages are written to a log file /tmp/jvm-debug.log:
% java -Xlog:os=debug:file=/tmp/jvm-debug.log --version
openjdk 9
OpenJDK Runtime Environment (build 9+181)
OpenJDK 64-Bit Server VM (build 9+181, mixed mode)
Afterwards we should be able to read the log-file created:
% cat /tmp/jvm-debug.log
[0.001s][debug][os] Initial active processor count set to 8
[0.006s][info ][os] SafePoint Polling address: 0x00007f93e1460000
[0.006s][info ][os] Memory Serialize Page address: 0x00007f93e145f000
[0.006s][info ][os] HotSpot is running with glibc 2.23, NPTL 2.23
3.15.3. Configure Logging Information / Decoration
We may specify how to decorate our log messages. Therefore one ore more of the following flags may be applied to add useful information to our logs:
| Flag | Description |
|---|---|
time or t |
Current time and date in ISO-8601 format. |
utctime or utc |
Universal Time Coordinated or Coordinated Universal Time. |
uptime or |
Time since the start of the JVM in seconds and milliseconds. For example, 6.567s. |
timemillis or tm |
The same value as generated by System.currentTimeMillis(). |
uptimemillis or um |
Milliseconds since the JVM started. |
timenanos or tn |
The same value generated by System.nanoTime(). |
uptimenanos or un |
Nanoseconds since the JVM started. |
hostname or hn |
The host name. |
pid or |
The process identifier. |
tid or ti |
The thread identifier. |
level or |
The level associated with the log message. |
tags or tg |
The tag-set associated with the log message. |
In the following example, we want to display the time and date, the process-id, the thread-id,
the log-level and the tags for each log message that is tagged with os and has log-level debug:
% java -Xlog:os=debug:stdout:time,pid,tid,level,tags --version
[2018-04-27T10:15:10.874+0200][16423][16424][debug][os] Initial active processor count set to 8
[2018-04-27T10:15:10.879+0200][16423][16424][info ][os] SafePoint Polling address: 0x00007f0379b60000
[2018-04-27T10:15:10.879+0200][16423][16424][info ][os] Memory Serialize Page address: 0x00007f0379b5f000
[2018-04-27T10:15:10.879+0200][16423][16424][info ][os] HotSpot is running with glibc 2.23, NPTL 2.23
openjdk 9
OpenJDK Runtime Environment (build 9+181)
OpenJDK 64-Bit Server VM (build 9+181, mixed mode)
3.15.4. Disable Logging
We may disable logging and reset filters etc with -Xlog:disable:
Example:
% java -Xlog:disable --version
openjdk 9
OpenJDK Runtime Environment (build 9+181)
OpenJDK 64-Bit Server VM (build 9+181, mixed mode)
3.15.5. Default Log Settings
When -Xlog is used without further details it is equivalent to calling -Xlog:all=warning:stdout:uptime,level,tags
3.15.6. Show Usage Information
More information about the syntax and additional examples can be obtained by running the following
command: java -Xlog:help
% java -Xlog:help
-Xlog Usage: -Xlog[:[what][:[output][:[decorators][:output-options]]]]
         where 'what' is a combination of tags and levels of the form tag1[+tag2...][*][=level][,...]
         Unless wildcard (*) is specified, only log messages tagged with exactly the tags specified will be matched.

Available log levels:
 off, trace, debug, info, warning, error

Available log decorators:
 time (t), utctime (utc), uptime (u), timemillis (tm), uptimemillis (um), timenanos (tn), uptimenanos (un), hostname (hn), pid (p), tid (ti), level (l), tags (tg)
 Decorators can also be specified as 'none' for no decoration.

Available log tags:
 add, age, alloc, aot, annotation, arguments, attach, barrier, biasedlocking, blocks, bot, breakpoint, census, class, classhisto, cleanup, compaction, constraints, constantpool, coops, cpu, cset, data, defaultmethods, dump, ergo, exceptions, exit, fingerprint, freelist, gc, hashtables, heap, humongous, ihop, iklass, init, itables, jni, jvmti, liveness, load, loader, logging, mark, marking, methodcomparator, metadata, metaspace, mmu, module, monitorinflation, monitormismatch, nmethod, normalize, objecttagging, obsolete, oopmap, os, pagesize, patch, path, phases, plab, promotion, preorder, protectiondomain, ref, redefine, refine, region, remset, purge, resolve, safepoint, scavenge, scrub, stacktrace, stackwalk, start, startuptime, state, stats, stringdedup, stringtable, stackmap, subclass, survivor, sweep, task, thread, tlab, time, timer, update, unload, verification, verify, vmoperation, vtables, workgang, jfr, system, parser, bytecode, setting, event
 Specifying 'all' instead of a tag combination matches all tag combinations.

Described tag combinations:
 logging: Logging for the log framework itself

Available log outputs:
 stdout, stderr, file=<filename>
 Specifying %p and/or %t in the filename will expand to the JVM's PID and startup timestamp, respectively.
[..]
4. Linux System Analysis
4.1. Check the System Date/Time
| Sometimes a system’s date/time may be incorrect. This should be considered when dealing with timestamps in the different log files. |
$ date
Fri Mar  2 09:31:38 CET 2018
4.2. Cronjobs
Entry point /etc/crontab:
cat /etc/crontab
SHELL=/bin/sh
PATH=/usr/local/sbin:/usr/local/bin:/sbin:/bin:/usr/sbin:/usr/bin

# m h dom mon dow user  command
17 *    * * *   root    cd / && run-parts --report /etc/cron.hourly
25 6    * * *   root    test -x /usr/sbin/anacron || ( cd / && run-parts --report /etc/cron.daily )
47 6    * * 7   root    test -x /usr/sbin/anacron || ( cd / && run-parts --report /etc/cron.weekly )
52 6    1 * *   root    test -x /usr/sbin/anacron || ( cd / && run-parts --report /etc/cron.monthly )
#
Inspect the different cron files..
ls /etc/cron.*4.3. Network Traffic
| Use the information as a hint and be careful with the interpretation. |
4.3.1. TCP/UDP Statistics
Capture TCP and UDP communication every second with netstat.
netstat -t -u -c4.3.2. Statistics grouped by network device
ip -s link4.3.3. Helpful additional utilities
Others
A nice comparison and many other tools are listed here: http://www.binarytides.com/linux-commands-monitor-network/
4.4. List Running Services
When using systemd:
systemctl list-unit-files | grep enabledsystemctl list-units --type=service --state=running4.5. Processes
List all running processes, look for suspicious processes
ps -auxWe might want to sort by cputime:
ps -eLf --sort -pcpuUsing top is an option, too..
top4.6. Memory
4.6.1. free
% free -m
              total        used        free      shared  buff/cache   available
Mem:          31834        6119       19188         334        6526       25205
Swap:         32427           0       32427
4.6.2. procinfo
cat /proc/meminfo > meminfo.log4.6.3. Hardware Information (dmidecode)
dmidecode -t 174.7. Disk Usage
4.7.1. sar
sudo apt install sysstat
sar
4.7.2. iostat
sudo apt install sysstat
iostat                                                                                                                                                                                                                                                                                                                                                               2 ↵
Linux 4.13.0-36-generic (charon)        03/07/2018      _x86_64_        (8 CPU)

avg-cpu:  %user   %nice %system %iowait  %steal   %idle
           3,38    0,00    1,09    0,02    0,00   95,51

Device:            tps    kB_read/s    kB_wrtn/s    kB_read    kB_wrtn
sda              35,46       348,79       166,44    4046581    1930958
sdb               0,02         0,75         0,00       8652          0
dm-0             55,85       348,09       166,44    4038485    1930952
dm-1             55,49       347,41       166,44    4030585    1930948
dm-2              0,03         0,64         0,00       7408          4
dm-3              0,01         0,28         0,00       3240          4
4.7.3. /proc/diskstats
% cat /proc/diskstats
   7       0 loop0 0 0 0 0 0 0 0 0 0 0 0
   7       1 loop1 0 0 0 0 0 0 0 0 0 0 0
   7       2 loop2 0 0 0 0 0 0 0 0 0 0 0
   7       3 loop3 0 0 0 0 0 0 0 0 0 0 0
   7       4 loop4 0 0 0 0 0 0 0 0 0 0 0
   7       5 loop5 0 0 0 0 0 0 0 0 0 0 0
   7       6 loop6 0 0 0 0 0 0 0 0 0 0 0
   7       7 loop7 0 0 0 0 0 0 0 0 0 0 0
   8       0 sda 332855 182289 8093602 70364 79518 53760 3930924 72376 0 51932 142564
   8       1 sda1 211 28 10808 80 5 1 12 0 0 64 80
   8       2 sda2 2 0 4 0 0 0 0 0 0 0 0
   8       5 sda5 332542 182261 8078286 70264 74042 53759 3930912 67352 0 47200 137440
   8      16 sdb 284 0 17304 108 0 0 0 0 0 60 108
   8      17 sdb1 90 0 6432 20 0 0 0 0 0 20 20
   8      18 sdb2 117 0 7496 76 0 0 0 0 0 32 76
 253       0 dm-0 515988 0 8077411 194040 133418 0 3930912 151344 0 62100 345620
 253       1 dm-1 515564 0 8061610 194724 129543 0 3930904 151496 0 62716 346676
 253       2 dm-2 310 0 14817 164 2 0 8 0 0 100 164
 253       3 dm-3 131 0 6480 60 2 0 8 0 0 44 60
4.7.4. Free Disk Space (df)
% df -h
Filesystem                 Size  Used Avail Use% Mounted on
udev                        16G     0   16G   0% /dev
tmpfs                      3,2G  9,5M  3,1G   1% /run
tmpfs                       16G  402M   16G   3% /dev/shm
tmpfs                      5,0M  4,0K  5,0M   1% /run/lock
tmpfs                       16G     0   16G   0% /sys/fs/cgroup
/dev/sda1                  472M  378M   70M  85% /boot
cgmfs                      100K     0  100K   0% /run/cgmanager/fs
tmpfs                      3,2G   44K  3,2G   1% /run/user/1001
4.7.5. Disk Usage (du)
By hierarchical depth
% du -h -d 1                                                                                                                                                                    ✹ ✭
984K    ./.git
84K     ./resource-provider
628K    ./identity-server
1,7M    .
Summarize
% du -hs .
1,7M
4.7.6. Disk Activity Statistics (vmstat)
vmstat -D
           14 disks
            5 partitions
      1355425 total reads
       186787 merged reads
     23587076 read sectors
       524384 milli reading
       477021 writes
        75989 merged writes
     21726188 written sectors
       776316 milli writing
            0 inprogress IO
201 milli spent IO4.8. Disk Speed
4.8.1. Reading Speed (hdparm)
sudo hdparm -Tt /dev/sda

/dev/sda:
 Timing cached reads:   24268 MB in  1.99 seconds = 12177.61 MB/sec
 Timing buffered disk reads: 1562 MB in  3.00 seconds = 520.44 MB/sec
4.8.2. Writing Speed (dd)
| Be sure that you’re using a target directory that’s not a RAM-disk or you’ll end up testing your memory instead of your disk. |
dd if=/dev/zero of=/tmp/measure-output bs=8k count=10k;rm -f /tmp/measure-output

10240+0 records in
10240+0 records out
83886080 bytes (84 MB, 80 MiB) copied, 0,0606389 s, 1,4 GB/s
4.8.3. Writing Speed without Caching (dd)
sync; time sh -c "dd if=/dev/zero of=measure-output bs=8k count=10k  && sync";\
rm measure-output% sync; time sh -c "dd if=/dev/zero of=measure-output bs=8k count=10k  && sync";\
rm measure-output

10240+0 records in
10240+0 records out
83886080 bytes (84 MB, 80 MiB) copied, 0,0619918 s, 1,4 GB/s
sh -c "dd if=/dev/zero of=measure-output bs=8k count=10k  && sync"  0,01s user 0,06s system 29% cpu 0,238 total
4.8.4. IO Statistics (iotop)
iotop works similar to top but for disk/io.
sudo apt install iotop
iotop
4.9. CPU
4.9.1. /proc/stat
% cat /proc/stat
cpu  334163 3690 103399 11660297 3913 0 345 0 0 0
cpu0 52108 1695 14133 1443662 250 0 90 0 0 0
cpu1 34908 1510 7541 1472754 79 0 33 0 0 0
cpu2 51224 91 13504 1446581 161 0 34 0 0 0
cpu3 33456 45 14365 1466875 62 0 8 0 0 0
cpu4 53425 154 13774 1445241 143 0 10 0 0 0
cpu5 30025 47 11176 1470453 96 0 33 0 0 0
cpu6 45750 99 20209 1443585 98 0 9 0 0 0
cpu7 33264 46 8694 1471144 3022 0 124 0 0 0
intr 12088183 16 245 0 0 0 0 0 0 1 3534 0 0 472 0 0 0 140 426 0 2 0 0 0 60 0 171573 470076 7587 19 1386550 502 711950 0 0 0 0 0 0 0 0 0 0 0 0 0 0 0 0 0 0 0 0 0 0 0 0 0 0 0 0 0 0 0 0 0 0 0 0 0 0 0 0 0 0 0 0 0 0 0 0 0 0 0 0 0 0 0 0 0 0 0 0 0 0 0 0 0 0 0 0 0 0 0 0 0 0 0 0 0 0 0 0 0 0 0 0 0 0 0 0 0 0 0 0 0 0 0 0 0 0 0 0 0 0 0 0 0 0 0 0 0 0 0 0 0 0 0 0 0 0 0 0 0 0 0 0 0 0 0 0 0 0 0 0 0 0 0 0 0 0 0 0 0 0 0 0 0 0 0 0 0 0 0 0 0 0 0 0 0 0 0 0 0 0 0 0 0 0 0 0 0 0 0 0 0 0 0 0 0 0 0 0 0 0 0 0 0 0 0 0 0 0 0 0 0 0 0 0 0 0 0 0 0 0 0 0 0 0 0 0 0 0 0 0 0 0 0 0 0 0 0 0 0 0 0 0 0 0 0 0 0 0 0 0 0 0 0 0 0 0 0 0 0 0 0 0 0 0 0 0 0 0 0 0 0 0 0 0 0 0 0 0 0 0 0 0 0 0 0 0 0 0 0 0 0 0 0 0 0 0 0 0 0 0 0 0 0 0 0 0 0 0 0 0 0 0 0 0 0 0 0 0 0 0 0 0 0 0 0 0 0 0 0 0 0 0 0 0 0 0 0 0 0 0 0 0 0 0 0 0 0 0 0 0 0 0 0 0 0 0 0 0 0 0 0 0 0 0 0 0 0 0 0 0 0 0 0 0 0 0 0 0 0 0 0 0 0 0 0 0 0 0 0 0 0 0 0 0 0 0 0 0 0 0 0 0 0 0 0 0 0 0 0 0 0 0 0 0 0 0 0 0 0 0 0 0 0 0 0 0 0 0 0 0 0 0 0 0 0 0 0 0 0 0 0 0 0 0 0 0 0 0 0 0 0 0 0 0 0 0 0 0 0 0 0 0 0 0 0 0 0 0 0 0 0 0 0 0
ctxt 45637450
btime 1518501508
processes 22656
procs_running 3
procs_blocked 0
softirq 8143510 17 2772472 1017 25881 440193 0 32131 2812246 0 20595534.9.2. vmstat
% vmstat 1 3
procs ---------memory---------- ---swap-- -----io---- -system-- ------cpu-----
 r  b   swpd   free   buff  cache   si   so    bi    bo   in   cs us sy id wa st
 1  0      0 22033372 1827396 3878368    0    0    26    22  177   26  3  1 96  0  0
 0  0      0 22032068 1827396 3878384    0    0     0     0 1413 4537  2  1 97  0  0
 0  0      0 22032256 1827400 3878384    0    0     0    92 1115 3401  1  1 99  0  0
4.9.3. /proc/cpuinfo
cat /proc/cpuinfo > cpuinfo.log4.9.4. lscpu
% lscpu
Architecture:          x86_64
CPU op-mode(s):        32-bit, 64-bit
Byte Order:            Little Endian
CPU(s):                8
On-line CPU(s) list:   0-7
Thread(s) per core:    2
Core(s) per socket:    4
Socket(s):             1
NUMA node(s):          1
Vendor ID:             GenuineIntel
CPU family:            6
Model:                 58
Model name:            Intel(R) Core(TM) i7-3820QM CPU @ 2.70GHz
Stepping:              9
CPU MHz:               2693.935
CPU max MHz:           3700,0000
CPU min MHz:           1200,0000
BogoMIPS:              5387.87
Virtualization:        VT-x
L1d cache:             32K
L1i cache:             32K
L2 cache:              256K
L3 cache:              8192K
NUMA node0 CPU(s):     0-7
Flags:                 fpu vme de pse tsc msr pae mce cx8 apic sep mtrr pge mca cmov pat pse36 clflush dts acpi mmx fxsr sse sse2 ss ht tm pbe syscall nx rdtscp lm constant_tsc arch_perfmon pebs bts rep_good nopl xtopology nonstop_tsc cpuid aperfmperf pni pclmulqdq dtes64 monitor ds_cpl vmx smx est tm2 ssse3 cx16 xtpr pdcm pcid sse4_1 sse4_2 x2apic popcnt tsc_deadline_timer aes xsave avx f16c rdrand lahf_lm cpuid_fault epb pti tpr_shadow vnmi flexpriority ept vpid fsgsbase smep erms xsaveopt dtherm ida arat pln pts
4.9.5. Processes by CPU Time
ps -eo pid,user,pcpu,command --sort=-pcpu4.9.6. Threads for process
Display Processes with Threads (top)
or top -H // shift + h in topDisplay Thread for Process (top)
top -H -p PIDPrint Process Information to STDOUT (top)
Sends top into the batch processing mode to print out result after two iterations.
May be used to write information into an additional log file.
top -bn2 > cpu-top.log4.10. Open File Handles / Limits
|
An application may reach one of the open file limits when opening pipes, sockets or files. In a Java application ensure, that streams, sockets and so on are closed and use Java 7 try-with-resources blocks when possible. |
4.10.1. Count all open files
lsof | wc -l4.10.2. Open files by Process
lsof -p <PID>4.10.3. File Descriptor Usage/Limits
% sysctl fs.file-nr
fs.file-nr = 13024      0       3246615
1020 The number of allocated file handles. 0 The number of unused-but-allocated file handles. 70000 The system-wide maximum number of file handles.
4.10.4. System Limit of Open Handles
Shows the maximal limit for the system
% sysctl fs.file-max
fs.file-max = 3246615
4.10.5. Open File Limit per Process
ulimit -n4.11. Trace System Calls
| Tracing produces a lot of output but may be helpful to inspect the interaction of an application with the underlying operating system stack. |
strace -tt -ff -p PID5. Rescue Application Logs
| As logs may be rotated, deleted etc. we should save every log file close to the time of the incident as soon as possible. |
Typical locations to look for are..
5.1. Nginx
Log file locations are configured in /etc/nginx/nginx.conf or server declarations in /etc/nginx/sites-available.
Defaults files to look for:
-
/var/log/nginx/error.log -
/var/log/nginx/access.log
5.2. Apache
Config files reside in /etc/httpd, main config file is /etc/httpd/conf/httpd.conf.
Log files may be placed in /var/www/httpd/.
5.3. MySQL
Config files reside in /etc/mysql/my.cnf or /etc/my.cnf.
Log files may be found in /var/log/mysql.
5.4. OpenLDAP
Config files may reside here..
-
RHEL/CentOS:
/etc/openldap/slapd.conf -
Debian/Ubuntu:
/etc/ldap/slapd.conf -
FreeBSD:
/usr/local/etc/openldap/slapd.conf -
OpenBSD:
/etc/openldap/slapd.conf
Log files:
-
/var/log/openldap.logor if empty look in syslog/var/log/messagesor/var/log/syslog
5.5. Postfix
Config files reside in /etc/postfix, namely main.cf and master.cf.
Log files may be found in /var/log/maillog or /var/log/mail.log.
6. Database Analysis
| The following sections has a strong focus on Postgres and MySQL. |
6.1. Postgres
6.1.1. Finding slow queries
Edit in the configuration file postgresql.conf:
stats_command_string = onRead statistics using the following query:
SELECT pid, usename, query, query_start
FROM pg_stat_activity;
6.1.2. Slow Query Logging
Edit in the configuration file postgresql.conf:
log_min_duration_statement = 100This advises Postgres to log every query that takes 100ms or longer to execute.
We need to reload the database like this:
service postgresql reloadAfterwards we may inspect our slow queries in the slow-query-log defined in the pg_log directory
e.g. in /var/lib/pgsql/data/pg_log/.
6.1.3. Analyze Queries
Analyzing query without execution
EXPLAIN ANALYZE SELECT ...6.1.4. Ration between live and dead rows
ANALYZE VERBOSE tablename;6.1.5. Finding Sessions blocking another Session
SELECT pid, usename, pg_blocking_pids(pid) AS blocked_by,
       query AS blocked_query
FROM pg_stat_activity
WHERE CARDINALITY(pg_blocking_pids(pid)) > 0;
6.1.6. Create a Lock Monitor View
CREATE VIEW lock_monitor AS(
SELECT
  COALESCE(blockingl.relation::regclass::text,blockingl.locktype) as locked_item,
  now() - blockeda.query_start AS waiting_duration, blockeda.pid AS blocked_pid,
  blockeda.query as blocked_query, blockedl.mode as blocked_mode,
  blockinga.pid AS blocking_pid, blockinga.query as blocking_query,
  blockingl.mode as blocking_mode
FROM pg_catalog.pg_locks blockedl
JOIN pg_stat_activity blockeda ON blockedl.pid = blockeda.pid
JOIN pg_catalog.pg_locks blockingl ON(
  ( (blockingl.transactionid=blockedl.transactionid) OR
  (blockingl.relation=blockedl.relation AND blockingl.locktype=blockedl.locktype)
  ) AND blockedl.pid != blockingl.pid)
JOIN pg_stat_activity blockinga ON blockingl.pid = blockinga.pid
  AND blockinga.datid = blockeda.datid
WHERE NOT blockedl.granted
AND blockinga.datname = current_database()
);
We may now query our view for existing locks like this:
SELECT * from lock_monitor;Configure Autovacuum
Autovacuum table after 5000 inserts, updates, deletes:
ALTER TABLE table_name SET (autovacuum_vacuum_scale_factor = 0.0);
ALTER TABLE table_name SET (autovacuum_vacuum_threshold = 5000);
ALTER TABLE table_name SET (autovacuum_analyze_scale_factor = 0.0);
ALTER TABLE table_name SET (autovacuum_analyze_threshold = 5000);
Specific Tuning Options
On memory exhaust:
shared_buffers
work_mem
effective_cache_size
On too much IO:
checkpoint_segments
autovacuum_naptime
wal_buffers
6.2. MySQL
6.2.1. Slow Query Logging
Edit in my.cnf:
long_query_time=1000
slow_query_log=1
slow_query_log_file="/var/log/mysql/log-slow-queries.log"
Reload database:
service mysql reload6.2.2. InnoDB Locks
SHOW ENGINE INNODB STATUS6.2.4. Find User Locks
Activate mdl instrument
UPDATE performance_schema.setup_instruments
SET enabled = 'YES'
WHERE name = 'wait/lock/metadata/sql/mdl';
Or via my.cnf:
[mysqld]
performance-schema-instrument='wait/lock/metadata/sql/mdl=ON'
For demonstration purpose, we’re setting a sample lock:
SELECT GET_LOCK('samplelock', -1);Querying for locks now, should return a similar result:
SELECT * FROM performance_schema.metadata_locks
WHERE OBJECT_TYPE='USER LEVEL LOCK'\G

*************************** 1. row ***************************
          OBJECT_TYPE: USER LEVEL LOCK
        OBJECT_SCHEMA: NULL
          OBJECT_NAME: samplelock
OBJECT_INSTANCE_BEGIN: 140712993710032
            LOCK_TYPE: EXCLUSIVE
        LOCK_DURATION: EXPLICIT
          LOCK_STATUS: GRANTED
               SOURCE: item_func.cc:5549
      OWNER_THREAD_ID: 29
       OWNER_EVENT_ID: 5
1 row in set (0.00 sec)
6.2.5. Find Table Locks
SELECT
    pl.id
    ,pl.user
    ,pl.state
    ,it.trx_id
    ,it.trx_mysql_thread_id
    ,it.trx_query AS query
    ,it.trx_id AS blocking_trx_id
    ,it.trx_mysql_thread_id AS blocking_thread
    ,it.trx_query AS blocking_query
FROM information_schema.processlist AS pl
INNER JOIN information_schema.innodb_trx AS it
    ON pl.id = it.trx_mysql_thread_id
INNER JOIN information_schema.innodb_lock_waits AS ilw
    ON it.trx_id = ilw.requesting_trx_id
      AND it.trx_id = ilw.blocking_trx_id;
6.2.6. Long Running Queries
SELECT *
FROM INFORMATION_SCHEMA.PROCESSLIST
WHERE time>10
AND command<>"Sleep"
7. Log Analysis
7.1. Webserver Logs (goaccess)
sudo apt install goaccess
goaccess access.log -c
7.2. Access Logs
The tool also handles webserver logs..
sudo apt install petit
petit --mgraph logfile
8. Firewall
8.1. iptables
8.1.1. iptables log dropped input packets
iptables -N LOGGING
iptables -A INPUT -j LOGGING
iptables -A LOGGING -m limit --limit 2/min -j LOG --log-prefix "IPTables-Dropped: " --log-level 4
iptables -A LOGGING -j DROP
8.1.2. iptables log dropped outgoing packets
iptables -N LOGGING
iptables -A OUTPUT -j LOGGING
iptables -A LOGGING -m limit --limit 2/min -j LOG --log-prefix "IPTables-Dropped: " --log-level 4
iptables -A LOGGING -j DROP
9. Workflows
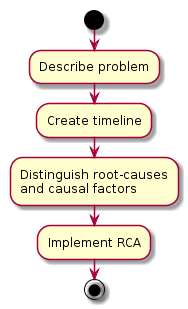
9.1. Root Cause Analysis (RCA)
-
a method of problem solving for identifying root causes of faults or problems[3].
The RCA can be used by following these four steps:
-
Create an exact description/definition of the failure or problem (five-whys-technique might help)
-
Create a timeline from the normal state to the failure
-
Identify root causes and distinguish them from other causal factors
-
Implement and constantly execute RCA to apply it as a method of problem prediction
10. Miscellaneous Tools
10.1. SLA Uptime Calculator
Calculate the mandatory uptime for a given percentual SLA agreement
11. TODO
| My //TODO list of topics where I need/want to add more information.. |
12. Imprint / Impressum
German law demands to include the following legal information:
12.1. Angaben gemäß § 5 TMG
Micha Kops
Pfarrer-Goedecker-Str. 27A
55130 Mainz
- Kontakt
-
E-Mail: webmaster AT hascode.com
12.2. Verantwortlich für den Inhalt nach § 55 Abs. 2 RStV
Micha Kops
Pfarrer-Goedecker-Str. 27A
55130 Mainz
12.3. Haftung für Inhalte
Als Diensteanbieter sind wir gemäß § 7 Abs.1 TMG für eigene Inhalte auf diesen Seiten nach den allgemeinen Gesetzen verantwortlich.
Nach §§ 8 bis 10 TMG sind wir als Diensteanbieter jedoch nicht verpflichtet, übermittelte oder gespeicherte fremde Informationen zu überwachen oder nach Umständen zu forschen, die auf eine rechtswidrige Tätigkeit hinweisen.
Verpflichtungen zur Entfernung oder Sperrung der Nutzung von Informationen nach den allgemeinen Gesetzen bleiben hiervon unberührt.
Eine diesbezügliche Haftung ist jedoch erst ab dem Zeitpunkt der Kenntnis einer konkreten Rechtsverletzung möglich. Bei Bekanntwerden von entsprechenden Rechtsverletzungen werden wir diese Inhalte umgehend entfernen.
12.4. Haftung für Links
Unser Angebot enthält Links zu externen Websites Dritter, auf deren Inhalte wir keinen Einfluss haben. Deshalb können wir für diese fremden Inhalte auch keine Gewähr übernehmen.
Für die Inhalte der verlinkten Seiten ist stets der jeweilige Anbieter oder Betreiber der Seiten verantwortlich.
Die verlinkten Seiten wurden zum Zeitpunkt der Verlinkung aufmögliche Rechtsverstöße überprüft. Rechtswidrige Inhalte waren zum Zeitpunkt der Verlinkung nicht erkennbar.
Eine permanente inhaltliche Kontrolle der verlinkten Seiten ist jedoch ohne konkrete Anhaltspunkte einer Rechtsverletzung nicht zumutbar.
Bei Bekanntwerden von Rechtsverletzungen werden wir derartige Links umgehend entfernen.
12.5. Urheberrecht
Die durch die Seitenbetreiber erstellten Inhalte und Werke auf diesen Seiten unterliegen dem deutschen Urheberrecht.
Die Vervielfältigung, Bearbeitung, Verbreitung und jede Art der Verwertung außerhalb der Grenzen des Urheberrechtes bedürfen der schriftlichen Zustimmung des jeweiligen Autors bzw. Erstellers.
Downloads und Kopien dieser Seite sind nur für den privaten, nicht kommerziellen Gebrauch gestattet.
Soweit die Inhalte auf dieser Seite nicht vom Betreiber erstellt wurden, werden die Urheberrechte Dritter beachtet.
Insbesondere werden Inhalte Dritter als solche gekennzeichnet.
Sollten Sie trotzdem auf eine Urheberrechtsverletzung aufmerksam werden, bitten wir um einen entsprechenden Hinweis.
Bei Bekanntwerden von Rechtsverletzungen werden wir derartige Inhalte umgehend entfernen.